
Format
DIGITAL - GIS - ESRI Shapefile
11 record(s)
Type of resources
Topics
Keywords
Contact for the resource
Provided by
Formats
Representation types
Update frequencies
Status
draft
-
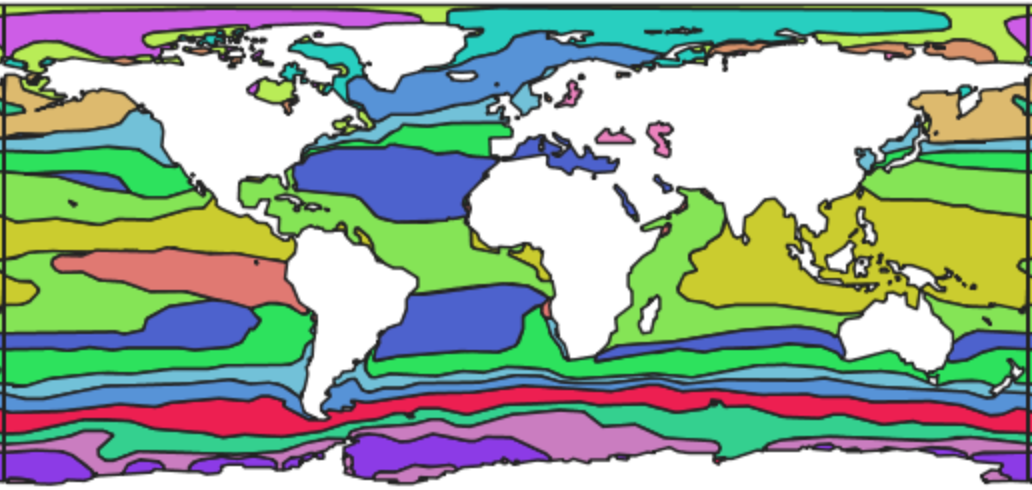
Physical Clustering of the World's Oceans (based on data extracted from World Ocean Atlas 2013 version 2). Data. The physical regions are based on the observations of the World Ocean Atlas 2013 version 2 (WOA13v2*; https://www.nodc.noaa.gov/OC5/woa13/). We extracted the decadal annual means for nine variables. These variables included: Temperature (°C), Salinity (unitless), Density (kg/m3), Dissolved Oxygen (ml/l), Apparent Oxygen Utilization (ml/l), Silicate (µmol/l), Phosphate (µmol/l), Density (kg/m^3) and Nitrate (µmol/l). The datasets for Temperature, Salinity and Dissolved oxygen were provided at 0.25° resolution. We therefore reprojected the remaining WOA13v2 datasets to the same projection by making each 1° cell in these datasets at 0.25° resolution, while assigning the original value to the four finer resolution cells. For the seafloor physical regions we included two additional dataset derived from GEBCO bathymetry data (https://www.gebco.net/). The first dataset was the bathymetry across the seafloor, this layer was re-projected to 0.25° resolution, were the cell values were based on the mean values of the finer scale GEBCO layer. We then computed the slope of depth based on the bathymetry raster using the ‘terrain’ function in the ‘raster’ package. Analysis. We generated physical clusters for the globe at the surface (0m), 200m, 1000m and the seafloor. For the surface, 200m and 1000m regions, we extracted the single depth layers from the WOA13v2 datasets and generated a matrix which represented the sites by the variables. For the seafloor, we had to generate interpolated layers at the seafloor based on the WOA13v2 data. We did this by looking at the mean depth of the bathymetry data and undertaking a tri-linear (cubic) interpolation of the WOA13v2 data at that seafloor depth. We subsequently ran a tri-linear interpolation of the WOA13v2 for each variable and generated maps of seafloor environmental conditions. One these maps were generated we extracted each variable into a seafloor site by seafloor physical variable matrix. All four site by physical variables datasets (0, 200, 1000 and seafloor) were then scaled in an attempt to centre and normalise the data. For each of these four datasets we then fitted a k-means clustering model from 2 to 40 clusters and looked at the resulting model loglikelihood, AIC and BIC. We then selected the number of clusters at the point were the the log-likelihood converged (i.e. the point were additional centroids only gave a marginal increase in log-likelihood). The resulting cluster identity was then assigned to each site and used to generate maps of the physical clusters for each dataset. These rasters were then converted to shapefiles. * Boyer, T.P., J. I. Antonov, O. K. Baranova, C. Coleman, H. E. Garcia, A. Grodsky, D. R. Johnson, R. A. Locarnini, A. V. Mishonov, T.D. O'Brien, C.R. Paver, J.R. Reagan, D. Seidov, I. V. Smolyar, and M. M. Zweng, 2013: World Ocean Database 2013, NOAA Atlas NESDIS 72, S. Levitus, Ed., A. Mishonov, Technical Ed.; Silver Spring, MD, 209 pp., http://doi.org/10.7289/V5NZ85MT
-
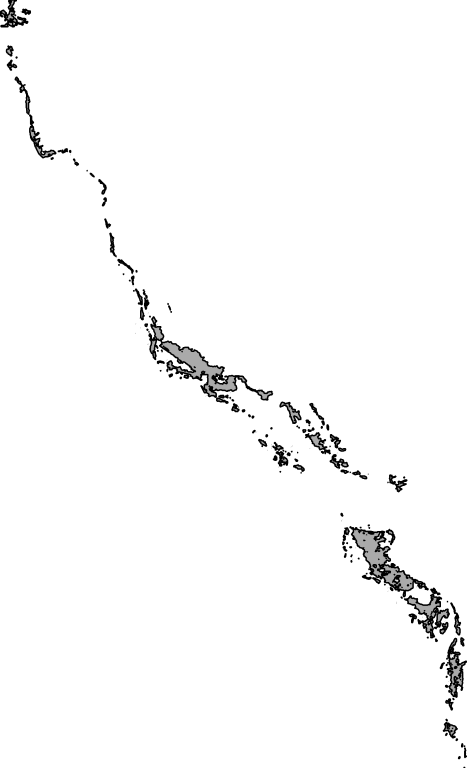
This resource describes a sample extent region for use in the Kaleidoscope spatial portal: https://kaleidoscope.terria.io/ No attribute data are presented.
-
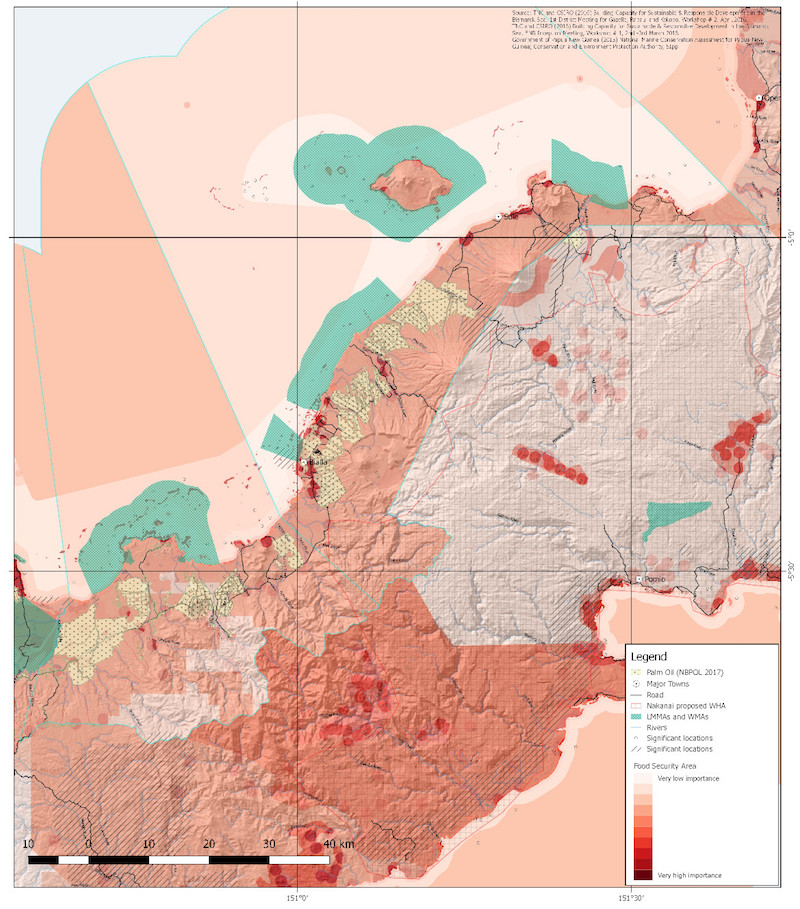
We have developed a framework for collating and presenting information on the values of marine and coastal ecosystems to relevant stakeholders for planning and decision making tasks in New Britian, Papua New Guinea. The framework includes the following design criteria: • Includes a comprehensive range of value types, including socio-cultural, economic and ecosystem values, and all four ecosystem services types (provisioning, cultural, regulating and supporting). • Has the ability to reflect the different value (scalar) contexts of local, Provincial and National stakeholders. • Is spatial, being based on ecosystem feature layers. • Has the capacity to be spatially comprehensive, by including a full range of ecosystem features in the focus area. • Does not rely on monetisation or attempt to calculate a single value (e.g. TEV), but rather relies on a plurality of values. Attempts to presents information in a transparent, relevant, replicable and credible way. Our approach is built on contemporary approaches to the valuation of ecosystems for planning and management. This includes the expression of pluralist values and appropriate consideration of scale. Pluralist values recognises that there is value in reflecting a broad range of value types when considering the value of ecosystems across ecological, socio-cultural and economic values. There are four categories of values represented in the framework: ecosystem structure and processes (biodiversity, productivity, connectivity); ecosystem regulatory functions (climate, pest, and pollution regulation; hazard protection); ecosystem goods and services supply (food, fibre and fuel); and shared social values (spiritual, aesthetic, recreation, existence values). This represents a comprehensive range of value types as defined by a range of valuing frames, including ecosystem services, economic valuation and socio-cultural valuing approaches. A fundamental basis of our framework is that it is feature based – including both ecosystem and man-made features. The full range of socio-cultural, economic and ecological values can then be associated with that feature, and these can then be overlain in spatial systems to produce a comprehensive spatial valuation. In addition, the socio-cultural values associated with man-made features (such historical wrecks, buildings etc.) can be captured in the spatial values system.
-
Official NWSJEMS Study Area boundary. Bounding box extends from west of North West Cape to Port Hedland. This study area boundary is based on the extent of data used for modelling purposes.
-
The NWSJEMS Contaminants Inventory contains primary contaminant load data: polygon data shows spatial location of outflows to the marine environment and time series of contaminant shows loads and species of contaminant.
-
NWSJEMS Contaminants Input Inventory, spatial location of inputs to the marine environment - point features.
-
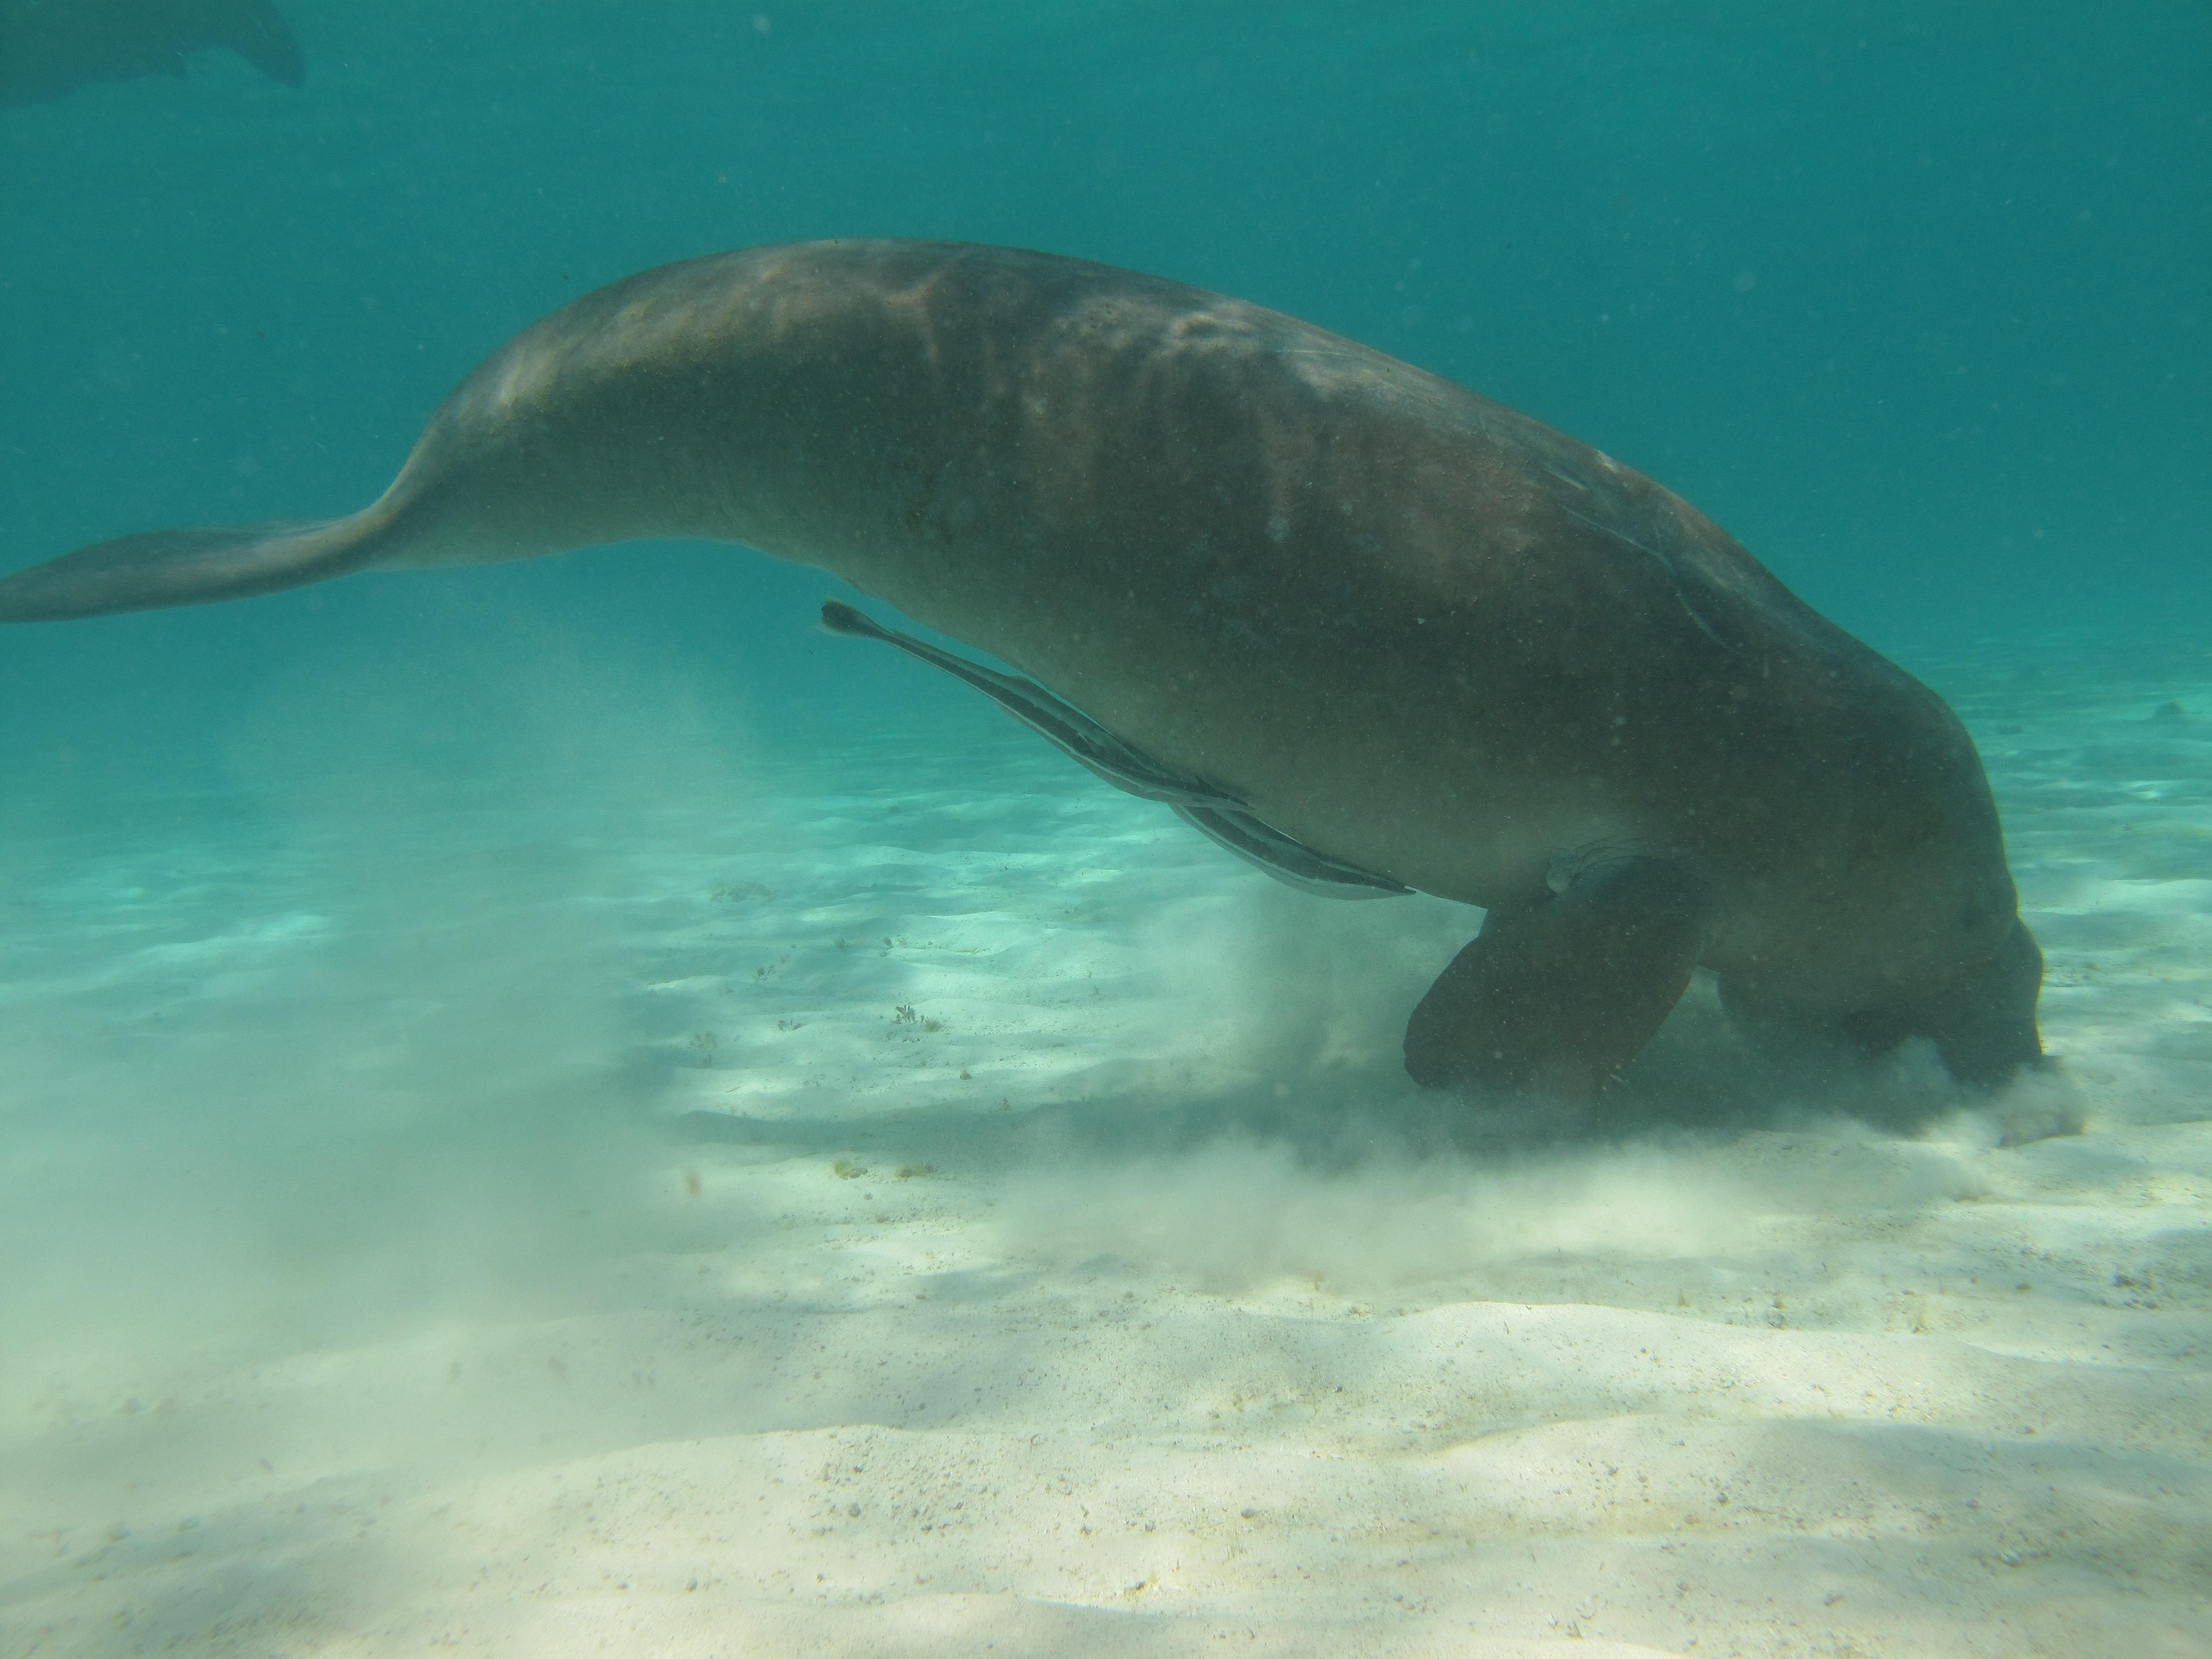
Dugongs (Dugong dugon) are listed as vulnerable on the IUCN Red List of Threatened species and as other specially protected fauna in WA under Schedule 7 of the Wildlife Conservation (Specially Protected Fauna) Notice 2015). Gaps in our knowledge in Western Australia include having a good understanding of the species’ distribution, abundance and high use areas across the northwest. This 3-year project (2014-2017) integrated Indigenous knowledge and scientific observations from field surveys to better understand the distribution, abundance and movements of dugong in the Kimberley region. The data collected also provides a baseline for future monitoring and management. This medata record relates to raw and processed aerial survey data of marine fauna collected between 21st September 2015 and 8th October 2015 in Kimberley coastal waters to the 20m bathymetry line, comprising dugongs (Dugong dugon), Australian snubfin dolphins (Orcaella heinsohni), other dolphins (bottlenose, spinners, false killer whales), humpback whales (Megaptera novaeangliae) and large, mostly green turtles (Chelonia mydas). The WA Department of Biodiversity Conservation and Attractions (DBCA, ex-DPaW) and CSIRO provided additional resources to extend the North Kimberley dugong aerial survey boundary westwards (Broome to just past Port Hedland) to cover the South Kimberley-Pilbara coastal regions, to close the last remaining knowledge gap of the dugong distribution and abundance in Australia. This additional survey was completed in May 2017. Data from a trial movement study undertaken between 1-18th August 2016 also forms part of this metadata record. Five dugongs were tagged with Telonics manatee/dugong tags. GPS and ARGOS satellite detection locations and dive data were downloaded weekly from the ARGOS web site.
-
NWSJEMS study outputs are accessed using this application which is normally distributed on DVD with the accompanying datasets. ViewNWS is a user interface and dataset which was designed for the presentation of environmental, social and economic data, the very factors that depict the state of an ecosystem as it evolves in response to natural forcing and human use. There are several ViewNWS Management Strategy Evaluation (MSE) displays which include maps, digital images and time series data. The software is written in Visual Basic and uses ESRI Map Objects for the spatial component.
-
The Data Trawler is a Java application that has been developed under the auspices of the North West Shelf Joint Environmental Management Project (NWS JEMS) and the CMAR Data Centre. This application provides on-line access to the data in the Data Warehouse, an Oracle data repository. See MarLIN record 6390 for details of the Warehouse. The Trawler's primary functions are to allow users to: Discover - Discover data of interest using geographic, temporal and data category search criteria. Investigate - View a brief summary of any data sets returned which meet the search criteria and display their spatial distribution. Download - Place desired datasets into a data "shopping basket" and then download them to your local computer. To get the full benefit out of using the application a user is required to provide an email address (a logon) and a password. If you are not a CMR staff member or other authorised user you will be allowed access to the Warehouse as a "Public User". Public users have only limited access to Warehouse content. See the Data Link to access the CMR Data Trawler.
-
CMAR has conducted a number of stock assessment surveys for finfish, beche-de-mer and trochus on the reefs of Torres Strait. During the course of the suveys, habitat data was also collected albeit at a coarser level of taxonomic resolution. The primary objective of this study was to characterise the reefs of Torres Strait in terms of the biological and habitat data collected during these surveys and to relate the nature of the reefs to the available physical data. Information collated for this study included comprehensive datasets on reef fish, beche-de-mer and seagrass; most of which was identified to species level. Information on corals and algae was based on visual estimates of percentage cover morphotypes. Little data on the other reef biota was collected. SOURCE_DATASET CRUISE_ID CRUISE_NAME CRUISE_YEAR RRI1 HE01 Reef Resource Inventory HE01 1995 RRI2 HE02 Reef Resource Inventory HE02 1995 WR95 WRS Warrior survey 1995 1995 RRI3 JK01 Reef Resource Inventory JK01 1996 RRI4 JK02 Reef Resource Inventory JK02 1996 WR96 WRS Warrior survey 1996 1996 WR98 WRS Warrior survey 1998 1998 WR00 WRS Warrior survey 2000 2000 ETS2 ETS2 East Torres Strait 2002 2002 WE02 WRS Warrior survey 2002 2002 WR04 WRS Warrior survey 2004 2004 ETS5 ETS5 East Torres Strait 2005 2005